
9 stages of effective performance testing process

Even perfectly tested features fail if the system collapses under real traffic.
Software performance testing is a non-functional testing type that evaluates how a system behaves under specific workloads. It focuses on an application’s responsiveness, stability, and ability to handle increasing load, ensuring the system remains reliable in real-world usage.
In this article, we break down the performance testing process into 9 key stages and explain the purpose and activities of each step:
- Software analysis and requirements preparation
- Strategy design
- Load generator configuration
- Server and load generator monitoring
- Test data generation
- Load scripts development
- Preliminary tests launch
- Tests execution
- Results analysis and reporting
Stage 1 – Software analysis and requirements preparation
The system under test must be fully developed. Otherwise, test results may be unreliable or invalid.
Before conducting performance testing, ensure that the testing environment configuration is adjusted appropriately. When the system is deployed, functional testing should be carried out to ensure that the major functionality has no critical defects.
System analysis includes examining its features, operating mode, system architecture, and peculiarities. Detailed analysis is required to achieve the following purposes:
- simulate the most adequate user behavior patterns and load profile
- determine the necessary amount of test data
- find the system bottlenecks
- prepare recommendations for system improvements
These criteria form the performance requirements against which test results are evaluated.
Major emphasis should be placed on defining the success criteria for the tests conducted, which are usually included in the SLA (service-level agreement).
The requirements defined during the first stage will be compared to the results received to evaluate the product behavior and identify bottlenecks.
The following metrics are considered as success criteria:
| Metric | Definition |
| Virtual users | Virtual users simulate real user behavior by sending requests to the application. |
| Response time | The time system takes to process a request from a user. |
| Requests per second | A number of requests sent to the destination server. |
| Transactions per second | A number of transactions sent to the destination server. |
| Error rate | The percentage of errors from the total number of responses per unit time. |
| CPU usage | The percentage of the time the computer’s CPU uses for processing the workflow. |
| Memory usage | The amount of RAM available for all applications and processes. |
| Disk space usage | The information on the usage of the disk space. |
| Network | The network usage gives information on the data transmission speed from the server to the network adapter. |
Sometimes, system analysis and requirements gathering continue throughout the project lifecycle. If the software is already in use, analyzing user behavior helps identify the most critical parts of the application and understand how users interact with the system.
Book a consultation with the a1qa performance experts.
Stage 2 – Strategy design
At this stage, a clear performance testing strategy and methodology are defined to align technical objectives with business goals.
The testing strategy outlines the scope of testing, performance goals, application requirements, test environment configuration, monitoring approach, user behavior scenarios, load profiles, load models, selected tools, planned test runs, and reporting format. Using standardized performance testing terminology ensures clear and consistent communication among all stakeholders.
Test environment configuration
Performance testing results are highly sensitive to environmental factors, including infrastructure configuration, network conditions, data volume, and external system dependencies.
To ensure reliable and actionable results, performance testing should be executed in an isolated test environment that closely mirrors the production setup in terms of hardware, software, data, and network characteristics.
| Test environment elements | Features |
| Hardware |
|
| Software |
|
| Network |
|
| Application |
|
Load profile and load model design
Application usage statistics are collected during performance testing and serve as the basis for defining an accurate load profile that reflects real user behavior.
Multiple load models can be applied to the same test scenario. For example, virtual users may be added gradually over time or introduced simultaneously to simulate traffic spikes. Key load model parameters include request rate, test duration, and the number of concurrent users.
Choosing an optimal performance testing tool
Selecting the right performance testing tool depends on the application architecture, expected load, team expertise, and testing goals. Below are several widely used tools, along with their key advantages and limitations.
| Tool | Advantages | Disadvantages |
 |
|
|
 |
|
|
 |
|
|
If you’d like to use any other tool, just let us know and we’ll discuss which one best suits your goals.
We also recommend integrating performance tests into your CI/CD pipelines to identify and resolve regressions as soon as they occur.
Stage 3 – Load generator configuration
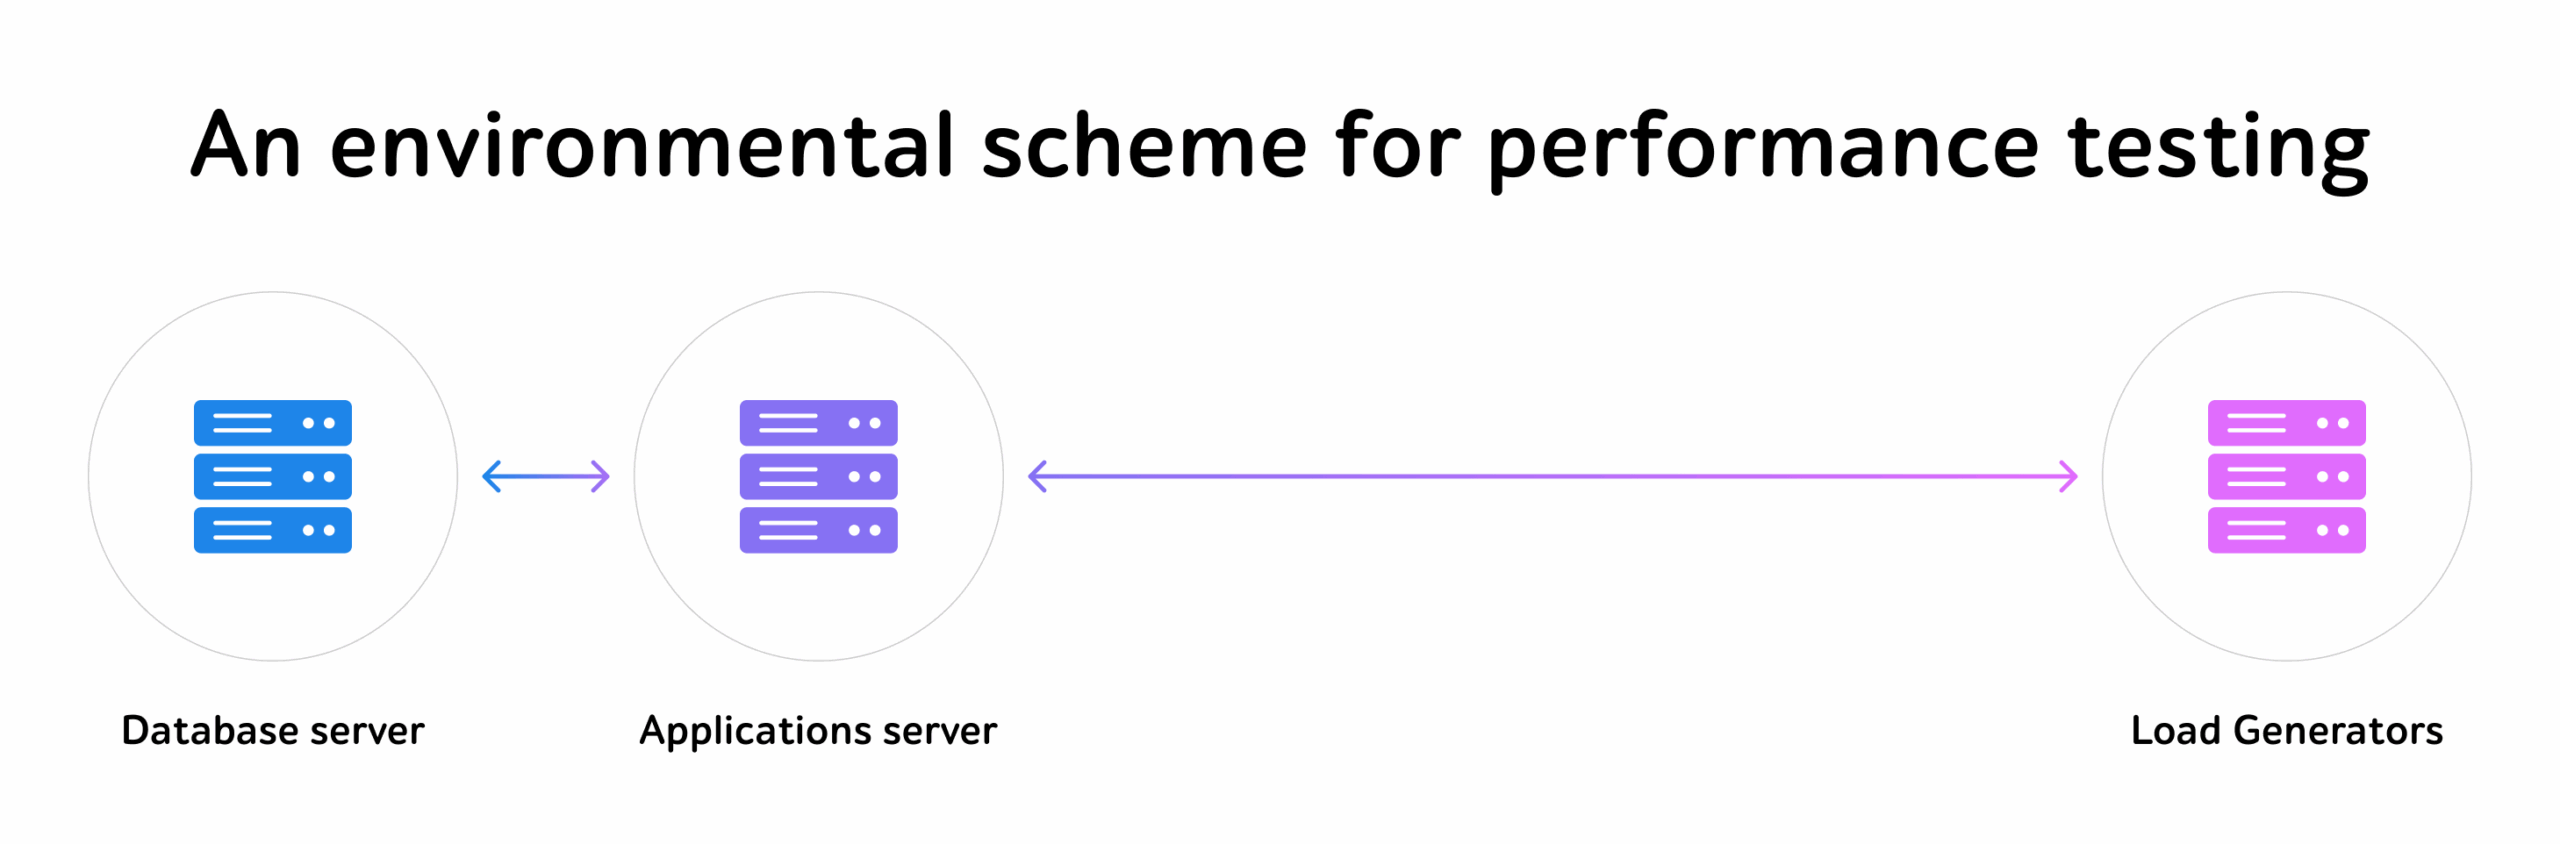
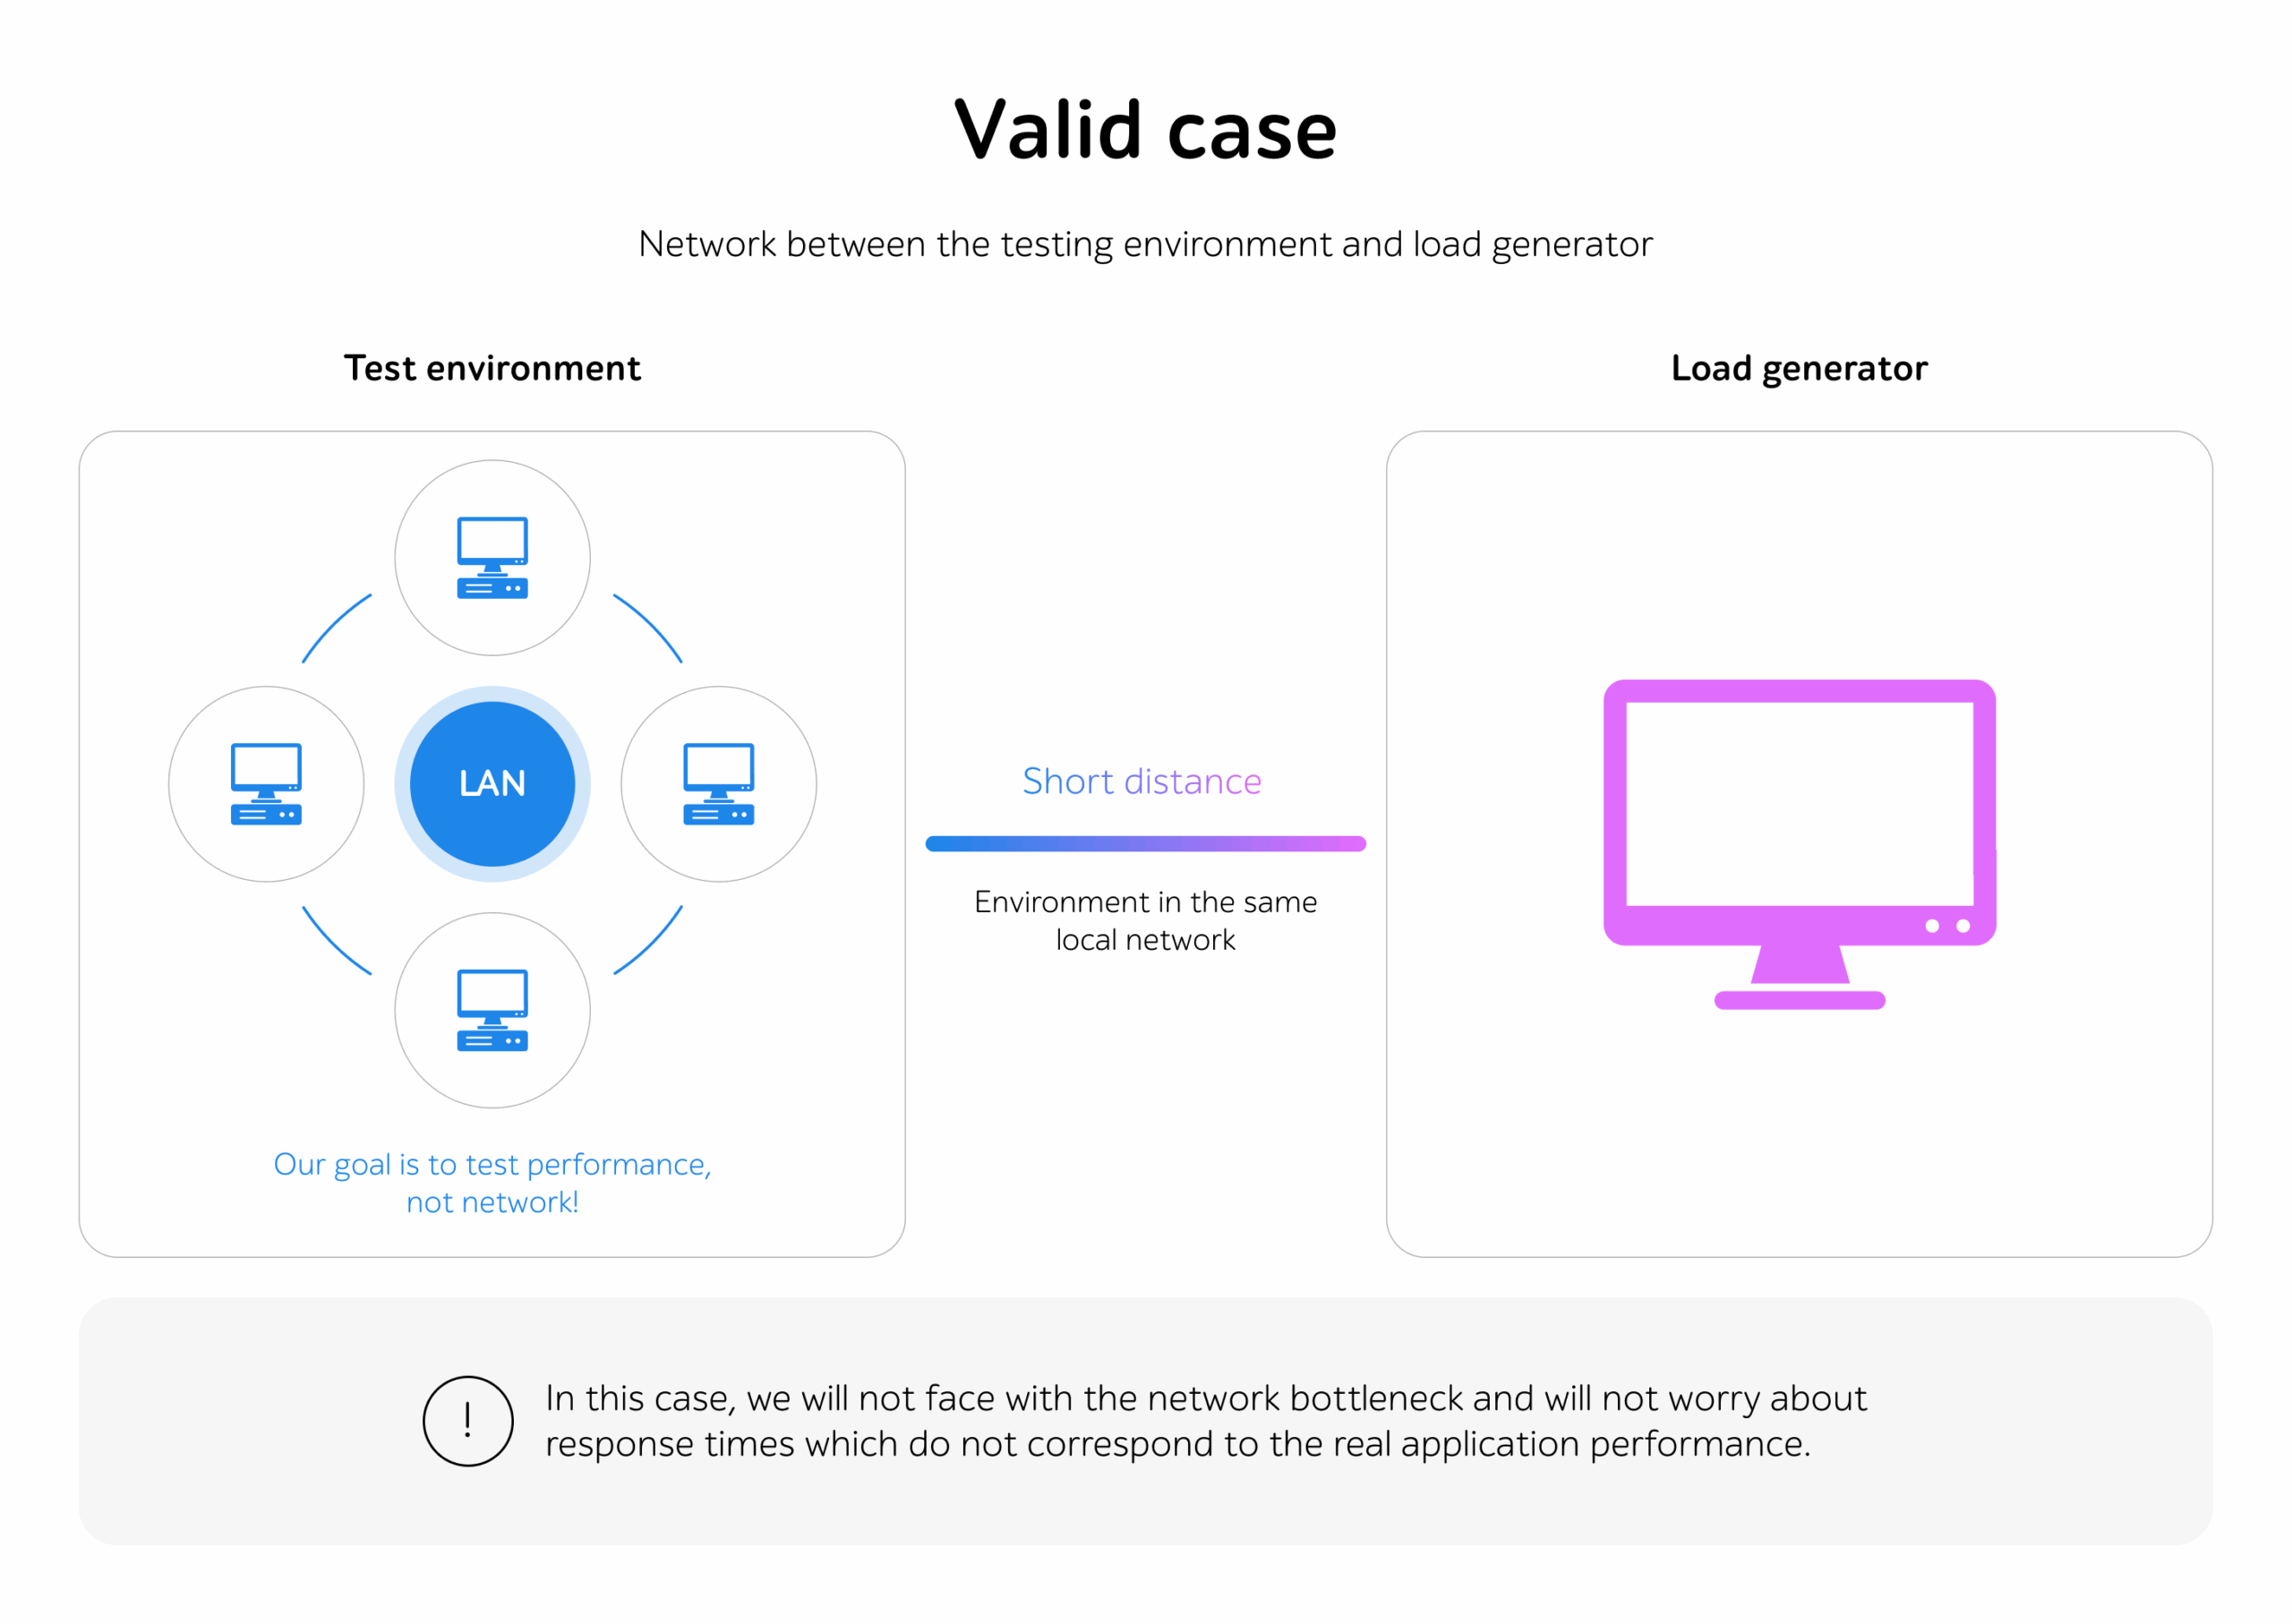
To achieve high-quality results, performance testing tools should be installed on a load generator. It is a virtual or physical machine located near the application server(s).
If a high load is required, the resources of a single machine may be insufficient. In this case, conducting distributed performance testing is ideal.
Additionally, cloud-based, and containerized load generation environments can be leveraged to ensure scalability, allowing teams to simulate large-scale traffic without being limited by on-premises infrastructure.
Stage 4 – Server and load generator monitoring
The metrics defined in the first stage are used to evaluate software performance and define the system bottlenecks.
The information obtained from monitoring of application servers and resources is used to analyze performance testing results.
Software monitoring can be conducted using automation performance monitoring tools (APM).
The most popular tools for hardware monitoring are enlisted below:
- Grafana
A powerful open-source data visualization and monitoring platform that supports multiple data sources such as Graphite, InfluxDB, OpenTSDB, and Prometheus. It enables interactive dashboards, real-time monitoring, and advanced analytics of time-series data.
- Prometheus
An open-source monitoring and alerting system that collects and stores time-series metrics from applications, services, and infrastructure components. It supports powerful querying (PromQL), alerting rules, and integration with visualization tools such as Grafana.
- Datadog
A cloud-based observability platform that provides real-time monitoring of infrastructure, applications, logs, and security events. It enables performance tracking, resource utilization analysis, distributed tracing, and alerting across cloud and hybrid environments.
- Dynatrace
An AI-driven solution that provides deep insights into hardware and system performance by automatically analyzing metrics, dependencies, and anomalies across infrastructure environments.
- New Relic
A cloud-based observability and application performance monitoring (APM) platform that provides real-time analytics across applications, infrastructure, logs, and user experience. It enables deep visibility into system behavior and performance across complex environments.
Experts will also dive deeper into system components and investigate the issue further using a range of specialized profiling tools.
Stage 5 – Test data generation
Let’s discuss four types of test data generation:
- Code
Scripts developed in various programming languages (Java, Python) allow user creation, passwords, and other values necessary for correct data usage.
- SQL queries
A database can also be filled with the help of SQL queries. This method is available only if there’s administrative access to the database.
The approach can be implemented as follows: first, create a complete DB in MS Access with fields identical to those in the server-side DB; second, create a dump file containing requests to add information to the DB.
- API calls
API requests can be used to fill the DB with items for sale or user data. One or two calls will be enough to send the data to the server.
- Interface
A script mimicking the steps of the user registration process can be developed to fill the database via the system interface.
New users created by the script are recorded in the database. A snapshot of the file system can be taken to use the created users for test execution before each test run.
One should also focus on maintaining the exact format and logic of production data while masking to hide all identifiable traits, thereby ensuring the highest level of data protection.
To get a consultation, drop us a few lines.
Stage 6 – Load scripts development
At this stage, performance testing scripts are created with the help of the chosen tool.
This stage includes:
- Scripts analysis
The prepared scripts should be analyzed before developing load test cases. Once each step has been checked manually and no errors have appeared, the load script can be recorded.
- Load testing scripts development
It’s important to create a template with no parametrization for each script.
Using Fiddler Everywhere or any other proxy server, one can ensure that all the queries from the template are similar to the queries from Fiddler Everywhere. When checked, all dynamic data should be parametrized to ensure that it works properly for various users.
- Scripts debugging
When requests with dynamic data are parameterized, they should be executed several times for various users working in parallel to ensure their proper functioning. If each scenario in the scripts works correctly, the script debugging stage can be considered complete.
It’s also recommended to design scripts with reusability and maintainability in mind, especially in Agile environments where frequent updates to application functionality may require rapid script adjustments.
Stage 7 – Preliminary tests launch
Preliminary checks help to determine the most appropriate load model for the system. They also show how the application resources are used and whether the load generator(s) power will be sufficient for executing full-scale tests.
A real-time example of such preliminary testing could include gradually increasing the number of concurrent users accessing an eCommerce platform to observe how server response time and resource consumption change.
The checks should be launched under different load models. Thus, the testing load is determined on the basis of software monitoring and results analysis. This approach follows a performance testing best practice, allowing competent teams to establish reliable benchmark values for system behavior.
Stage 8 – Tests execution
There are different types of performance testing:
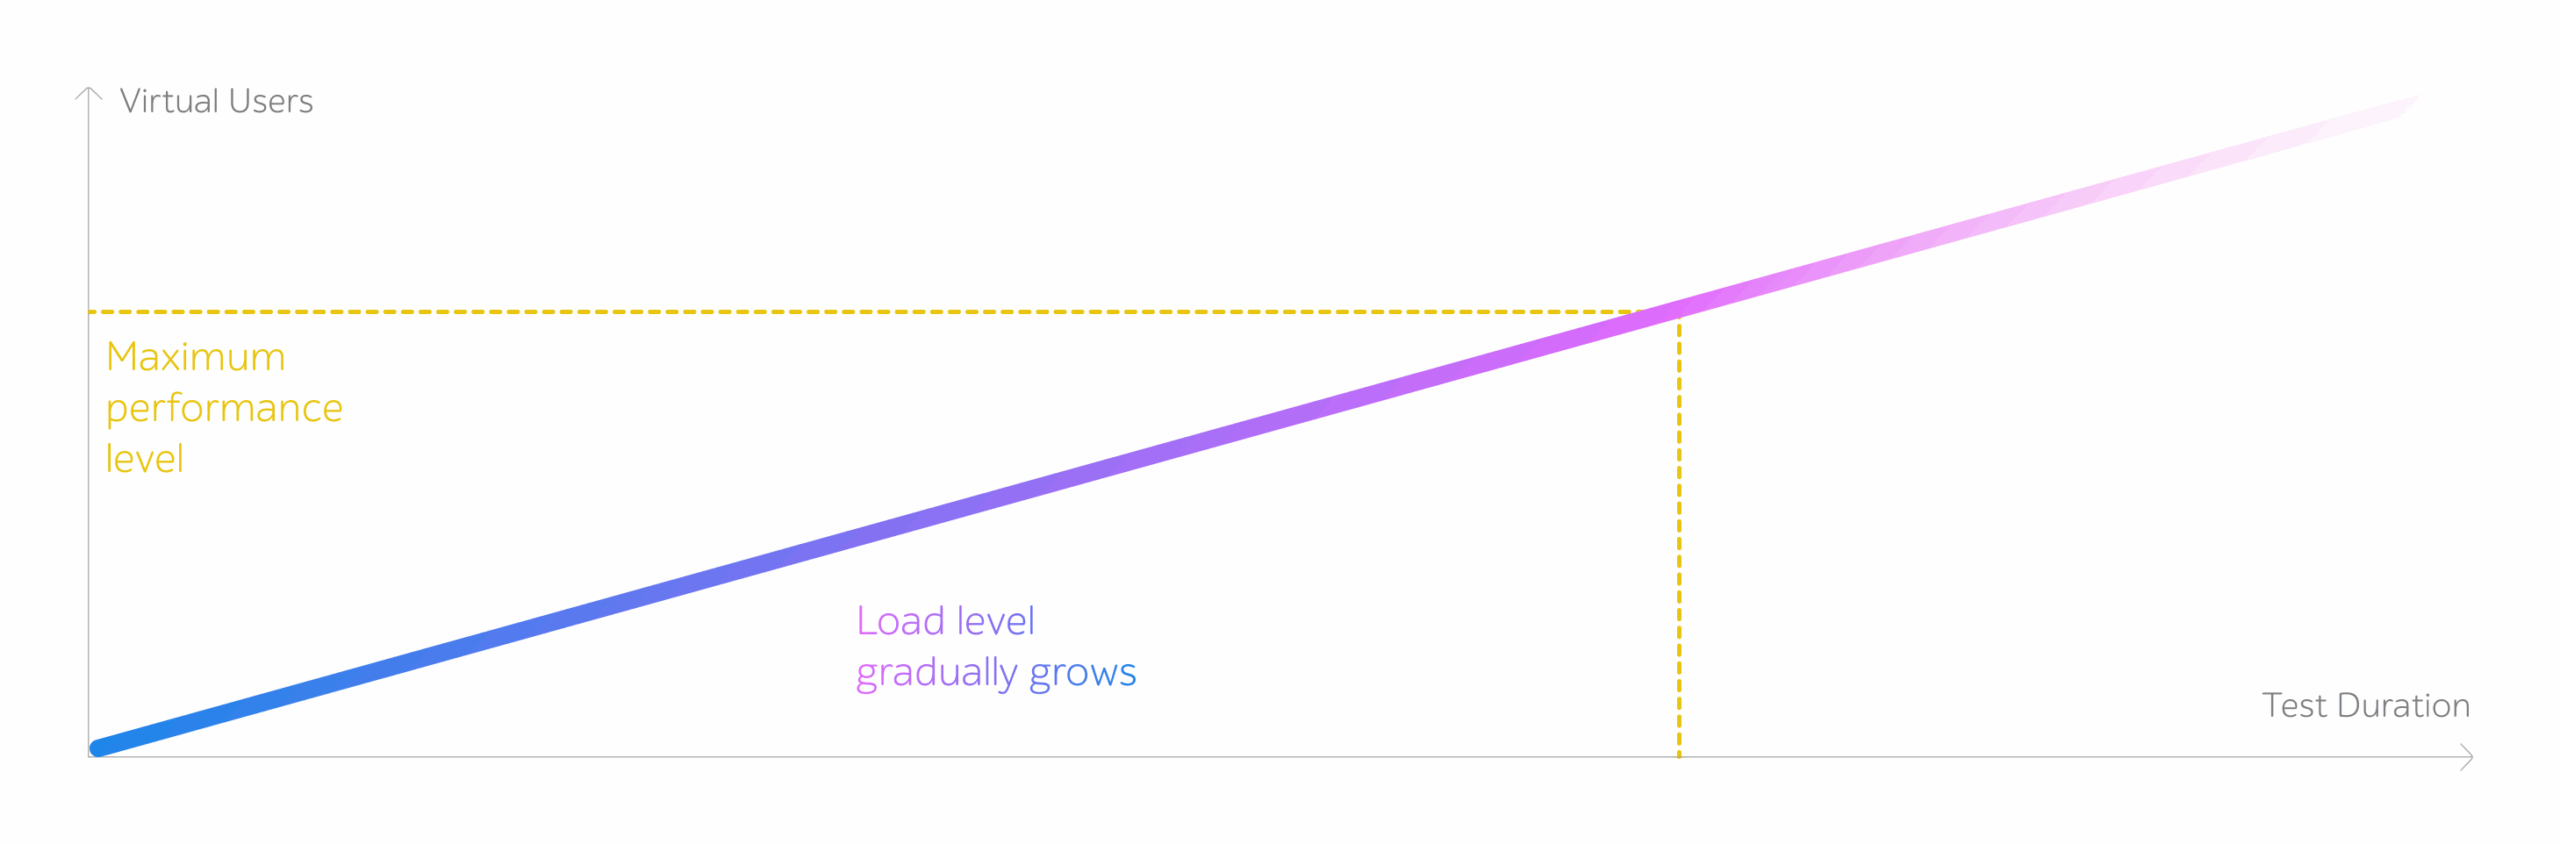
- During a stress test, the load will be gradually increasing until one of the test stopping criteria is reached.
Stress testing shows how the application reacts to an increased intensity of transactions and reveals the upper limit of the software performance.
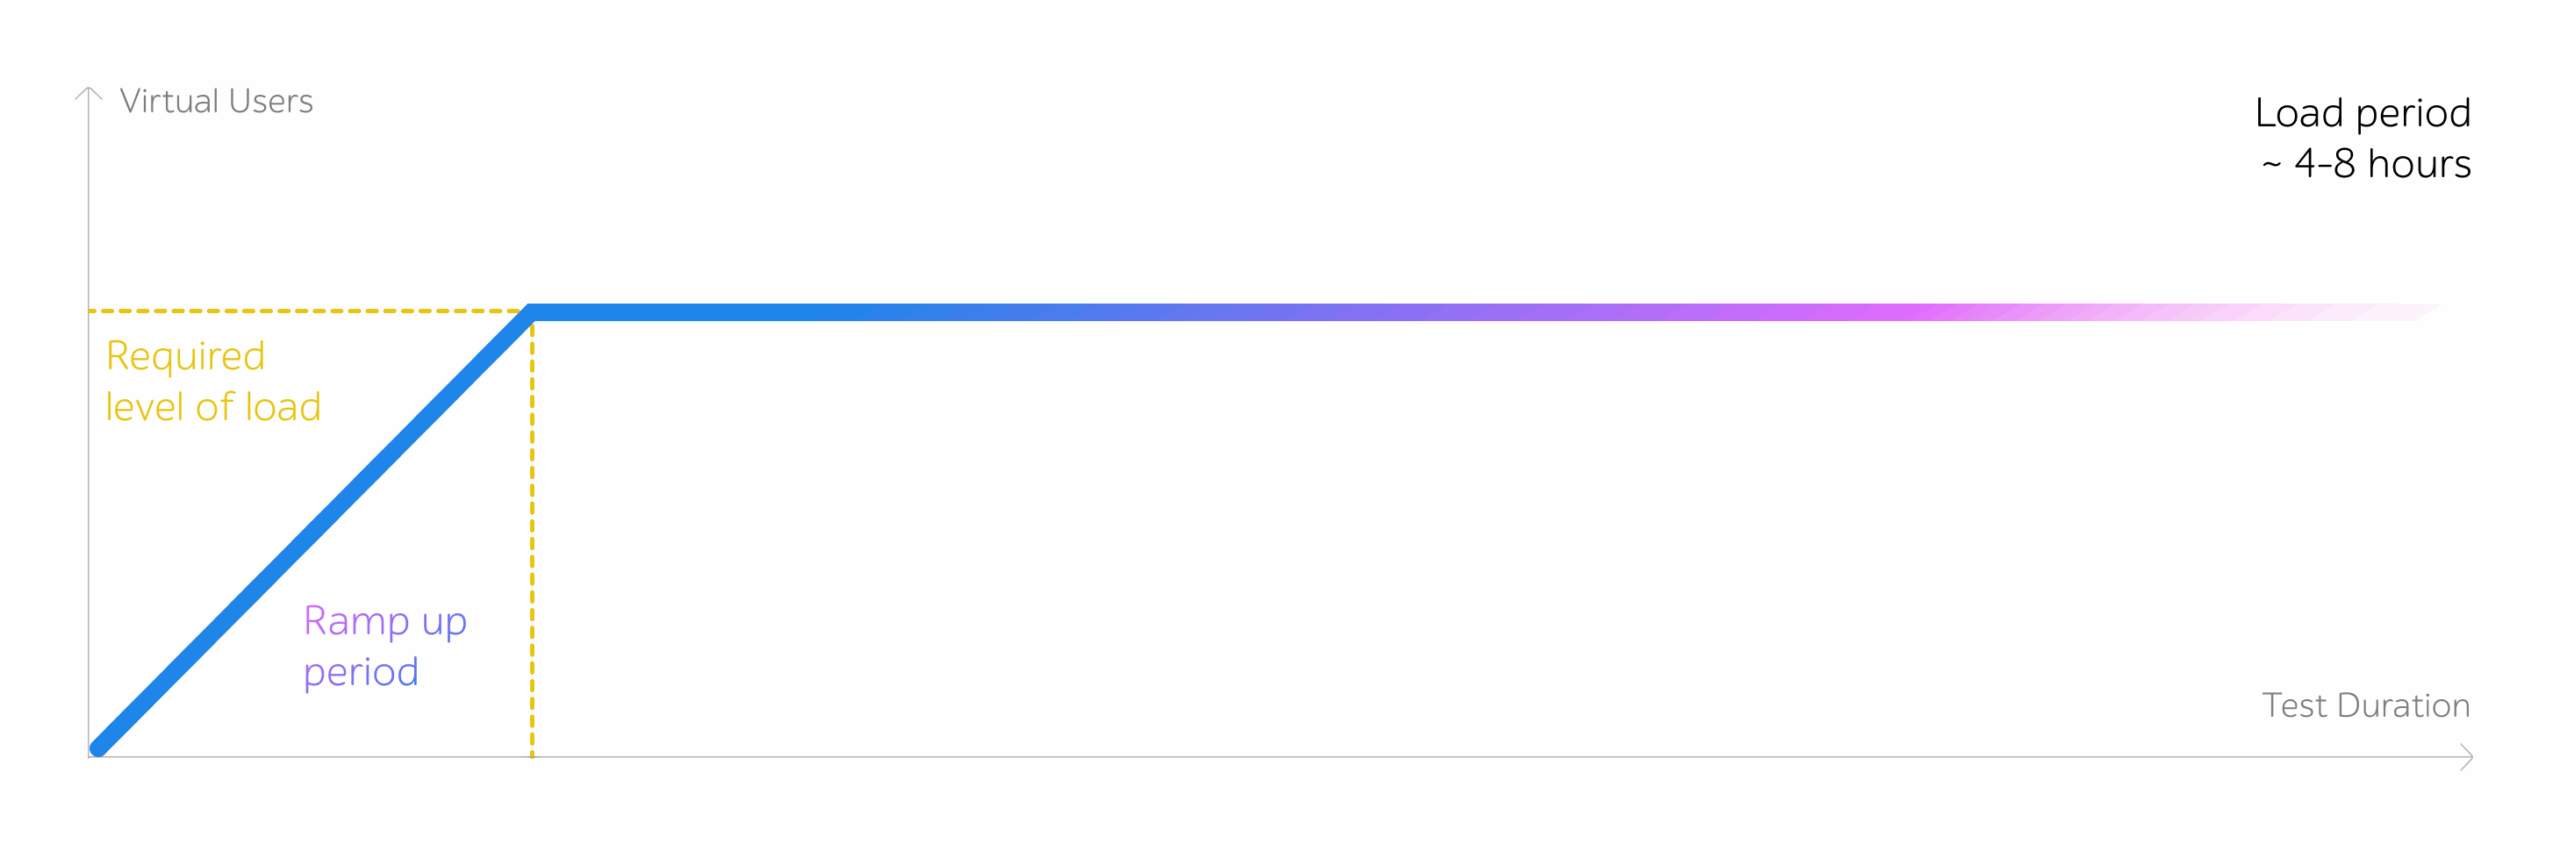
- A load test is executed for an extended period of time (4-8 hours).
If the results of the stress check showed that the system didn’t cope with the required load, the load test is executed under the load comprising 80% of the maximum value reached during the stress test.
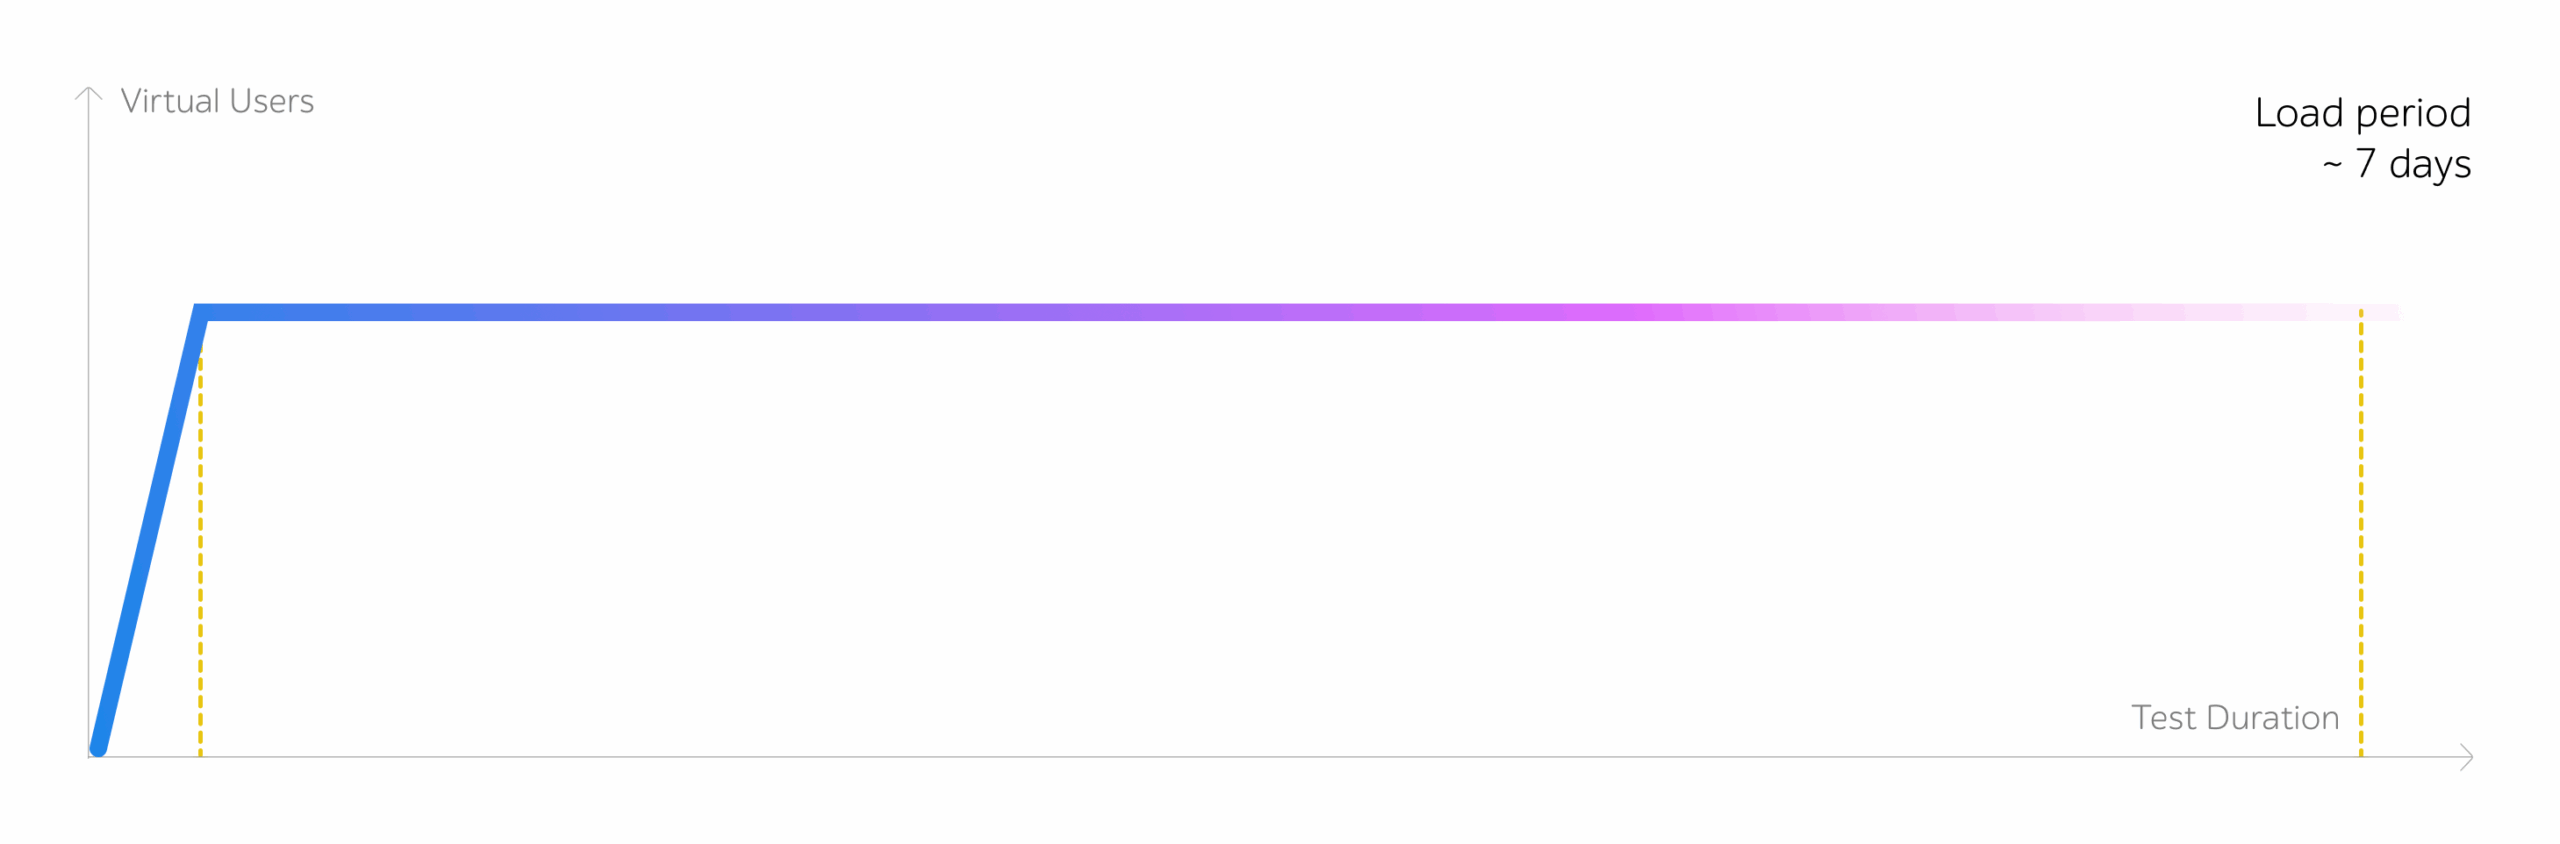
- The stability test is conducted under an expected load for an extended period of time. When the maximum number of users has been reached, the load remains the same until the end of the check. The duration of the stability test can take up to several days.
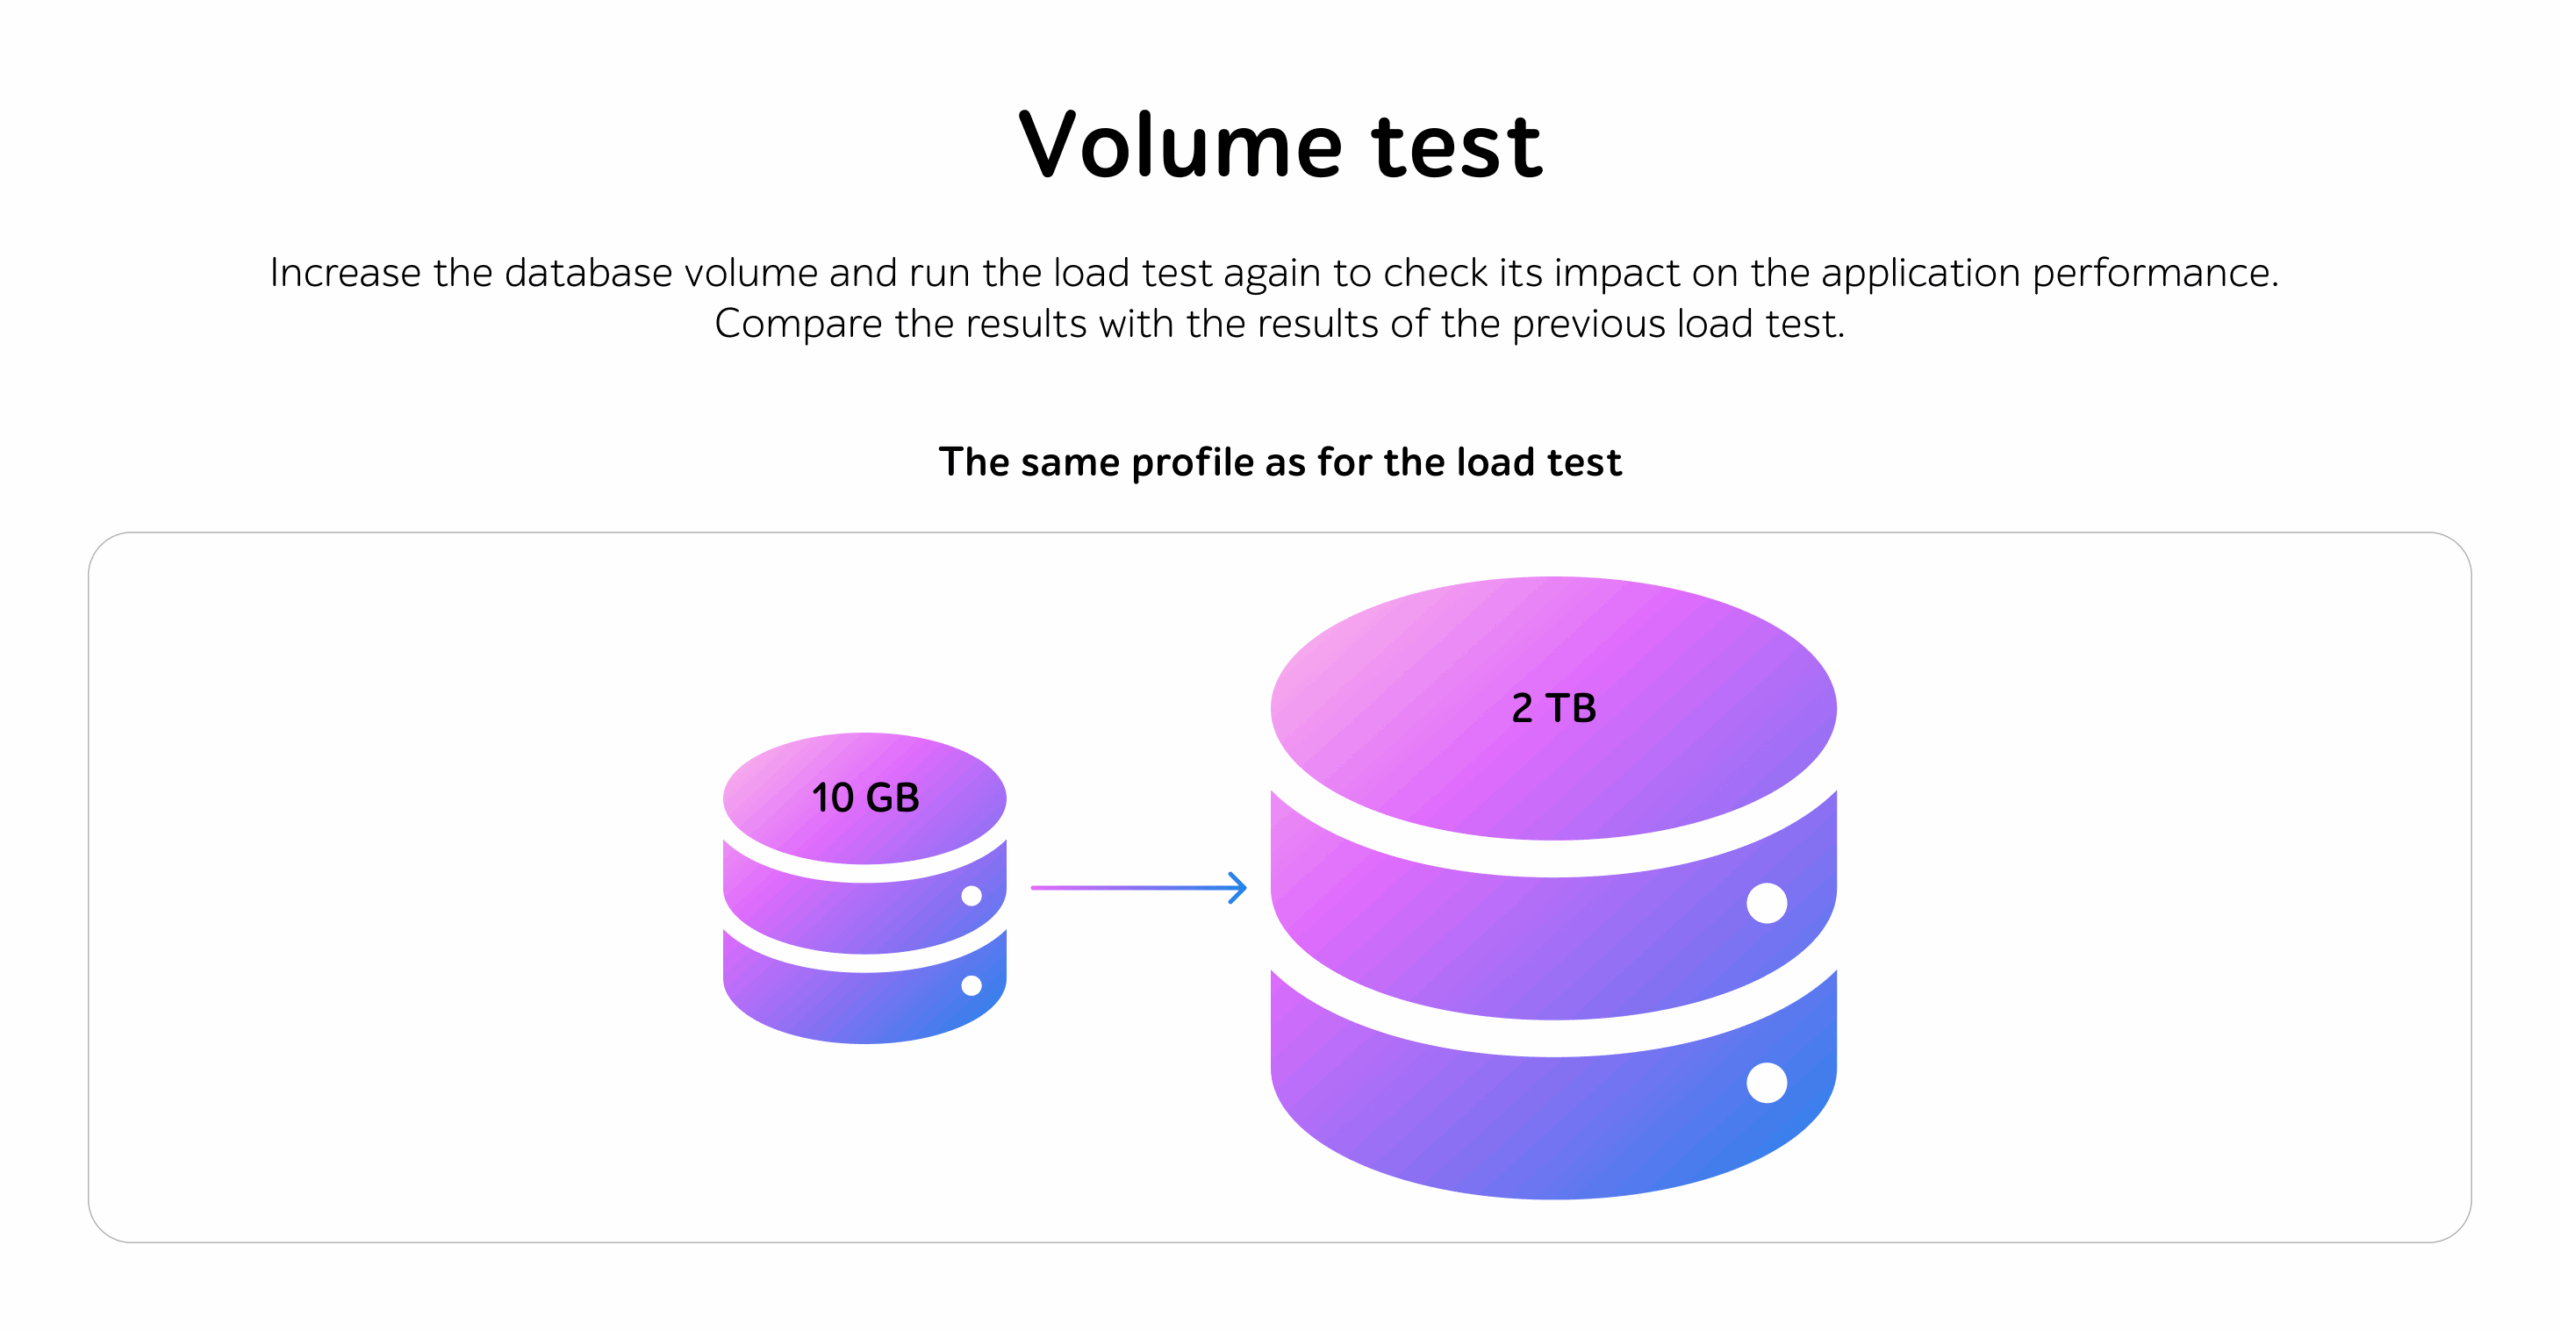
- Volume test is used to evaluate the system performance under increased data in the DB. To conduct volume testing, one should fill in the database with the necessary amount of information.
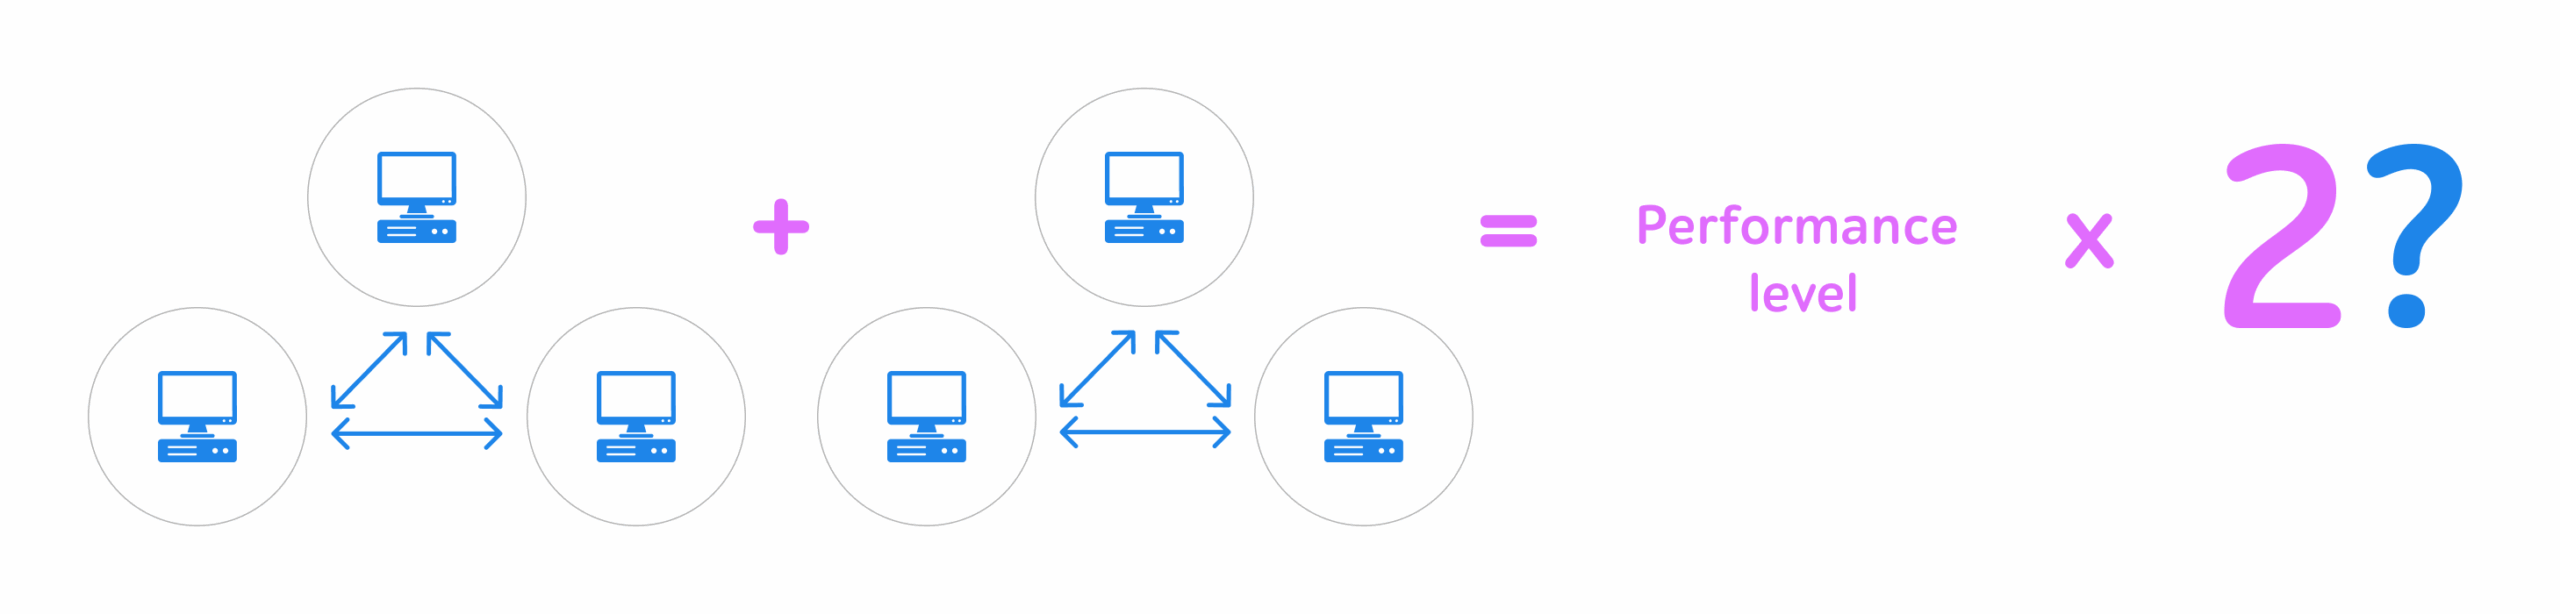
- Scalability test shows how the software performance is modified when the changes in the size of the application are made.
- During the component test, the load is independently applied to the software units.
- Rush hour check is executed to evaluate the system behavior both during the peak load and right after it. The load is applied to the application in a jump-like mode.
- Configuration test reveals the most appropriate software configuration, which can provide the required performance.
Stage 9 – Results analysis and reporting
The results of the previous stages are used to prepare a document describing the outcomes of the executed tests and the implementation of each stage.
A testing report typically summarizes key outcomes, including performance graphs, error statistics, transaction response times, and high-level insights, along with recommendations and an overall assessment of the system’s performance. Sample reports can be provided upon request.
Contact us to find out how performance testing experts can improve the quality of your solution.