Test automation metrics: evaluation of automation efficiency
In the previous article I went through the points, which describe the returns of test automation. Such parameters as improvement of quality rate (achieved by bigger scope & more often releases), decrease of test cycle, and, of course, bigger ROI determine automation efficiency in general.
The data on test automation effectiveness is collected through the whole process. So, when you urgently have to compose the process efficiency report you can apply to some basic metrics, which is the easiest and most rapid way to make a report.
When writing the report keep in mind, that it should be based upon the correlation of manual and automated testing. For an accurate summary deal with points like:
- Cost difference. The result cost of automated tests should be lower, than those of manual work. If the difference is obvious, a bit later you`ll see that the test automation pays its way, despite the large investment in test development. Moreover, when you know the release frequency and economy rate, it is possible to forecast, when the efforts get repaid.
- Duration. The duration of testing cycle in automation must be much less than in manual testing, due to that the results are gained sooner.
When you get to the report and calculations remember, that only a measurable software development process gets the accurate quantity indicators. If the report made to evaluate one BUILD, for example, is based upon the parameters of cost difference and duration, then the report describing the whole automation process is composed upon the points of ROI increase & result achievement.
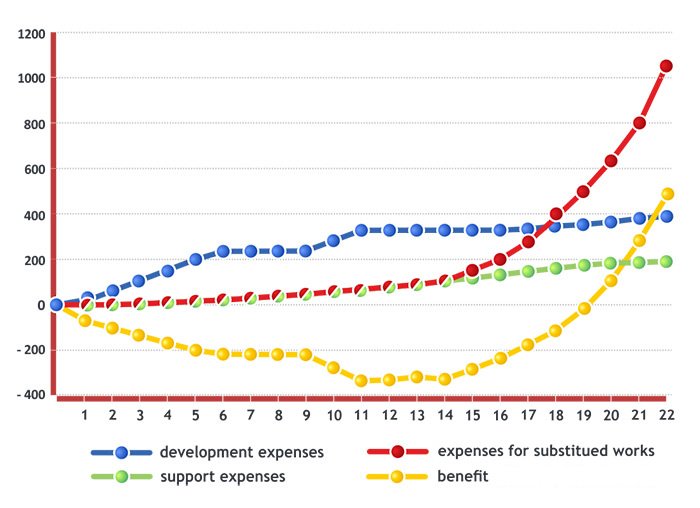
- ROI is calculated with the use of a well-known formula: ROI = benefits/costs. Where COSTS are the expenses for test development, execution and support; and BENEFITS are the expenses for substituted works excluding the costs.
In practice, if the releases come out 4 times per week, the ROI is gained in 3-4 months, if the cover is correct. Test duration is also quite an important parameter, especially, if tests get parallelized the results are 4 times better. Test duration is easily calculated upon the tests that last for more than 4 hours. But it`s no use to apply to this parameter on short test, the information you get is not sufficient.
The diagram below shows the specifics.

- Time2Market. Due to test automation the result is gained much sooner, which gives the opportunity to accelerate Time-to-Market. If such parameters as development speed and application delivery speed to the production environment can ALWAYS be measured, you should definitely use them to prove Time2Market acceleration, otherwise there is no point in calculations.
The stated points are the general ones that used for description of automation results. Of course, you can apply to some specifics parameters like LOSSES caused by delay during the delivery or new version testing. This parameter can describe the efficiency rate with money equivalent making, which gives a better view of benefits you get.
The parameters can be calculated, even if they weren`t permanently tracked, but this approach is suitable if the report is needed ASAP, though for a more profound report (ROI analysis and time2market) you`ll need to track all the process changes constantly.


